Published water-test evidence
Phuket Water Test Results
A transparent comparison of two Kamala shallow-well reports, including every recorded parameter, the stated test methods, original PDFs and the limits of what this before-and-after sample can prove.
Reviewed 12 October 2026 by the PWS installation team
What the documents record
Read the result before the claim
The reports describe two samples collected on different dates. The later report labels its sample “Big F Pro Filter”; the comparison below reports the recorded values without claiming that the filter alone caused every difference.
Physicochemical readings
Ten of the eleven listed physicochemical parameters in the later sample are within the ranges or maximums printed on the report.
Bacteria in the later sample
Total coliform bacteria and Escherichia coli are both recorded as “Not Detected” on the 18 March report.
Fluoride needs attention
Fluoride is recorded at 0.74 mg/L before and 0.88 mg/L later, above the report’s listed maximum of 0.7 mg/L in both samples.
Complete comparison
All 13 reported parameters
Values and standards are transcribed from the two one-page reports. “Within” refers only to the limit printed on those documents; it is not a general safety certification.
| Parameter | 5 Mar 2026 | 18 Mar 2026 | Report standard | Reading note |
|---|---|---|---|---|
| pH at 25.0 C- | 6.98 | 6.63 | 6.5-8.5 | Within the listed range in both reports. |
| Total dissolved solidsmg/L | 82 | 83 | <= 500 | Both readings are below the listed maximum. |
| ColourPt-Co | 1 | 4 | <= 15 | Both readings are below the listed maximum. |
| TurbidityNTU | 1.01 | 0.78 | <= 5 | Both readings are below the listed maximum. |
| Total hardnessmg/L | 58 | 61 | <= 300 | Both readings are below the listed maximum. |
| Chloridemg/L | 11.0 | 0.9 | <= 250 | The later sample records a lower reading; both are below the listed maximum. |
| Ironmg/L | 0.07 | 0.04 | <= 0.3 | The later sample records a lower reading; both are below the listed maximum. |
| Manganesemg/L | 0.08 | 0.05 | <= 0.3 | The later sample records a lower reading; both are below the listed maximum. |
| Nitrate-nitrogenmg/L as NO3-N | 0.90 | 4.00 | <= 50 | The later reading is higher; both are below the listed maximum. |
| Sulphatemg/L as SO4 | 7.00 | 4.25 | <= 250 | The later sample records a lower reading; both are below the listed maximum. |
| Fluoridemg/L | 0.74 | 0.88 | <= 0.7 | Both readings are above the maximum printed on the reports. |
| Total coliform bacteriaper 100 mL | 1.1 | Not detected | < 1.1 | The before result does not meet the printed < 1.1 criterion; the later report says not detected. |
| Escherichia coliper 100 mL | < 1.1 | Not detected | < 1.1 | The before result is below the stated threshold; the later report says not detected. |
Methods and sample context
What the reports tell us about the testing
The reports identify the analytical methods below. They do not name a separate testing laboratory, accreditation, chain of custody, measurement uncertainty or sampler.
Methods printed on the reports
| Parameter | Method shown |
|---|---|
| pH at 25.0 C | 4500-H+ B. Electrometric Method |
| Total dissolved solids | Electrometric Method |
| Colour | 2120 C. Spectrophotometric - Single-Wavelength Method |
| Turbidity | 2130 B. Nephelometric Method |
| Total hardness | 2340 C. EDTA Titrimetric Method |
| Chloride | 4500-Cl- B. Argentometric Method |
| Iron | 3500-Fe B. Phenanthroline Method |
| Manganese | 3500-Mn B. Persulfate Method |
| Nitrate-nitrogen | 4500-NO3- E. Cadmium Reduction Method |
| Sulphate | 4500-SO4 E. Turbidimetric Method |
| Fluoride | 4500-F- D. SPADNS Method |
| Total coliform bacteria | Multiple Tube Fermentation Technique |
| Escherichia coli | Multiple Tube Fermentation Technique |
Each report header states “Shallow Well 5.5-6.0m”, while the sample-source line states “Shallow Well 6.5m”. The page therefore describes the source simply as a Kamala shallow well and preserves this discrepancy for transparency.
Primary source documents
Inspect the original reports
The PDFs are the primary evidence. Page summaries are provided for accessibility and discovery, but do not replace the source files.
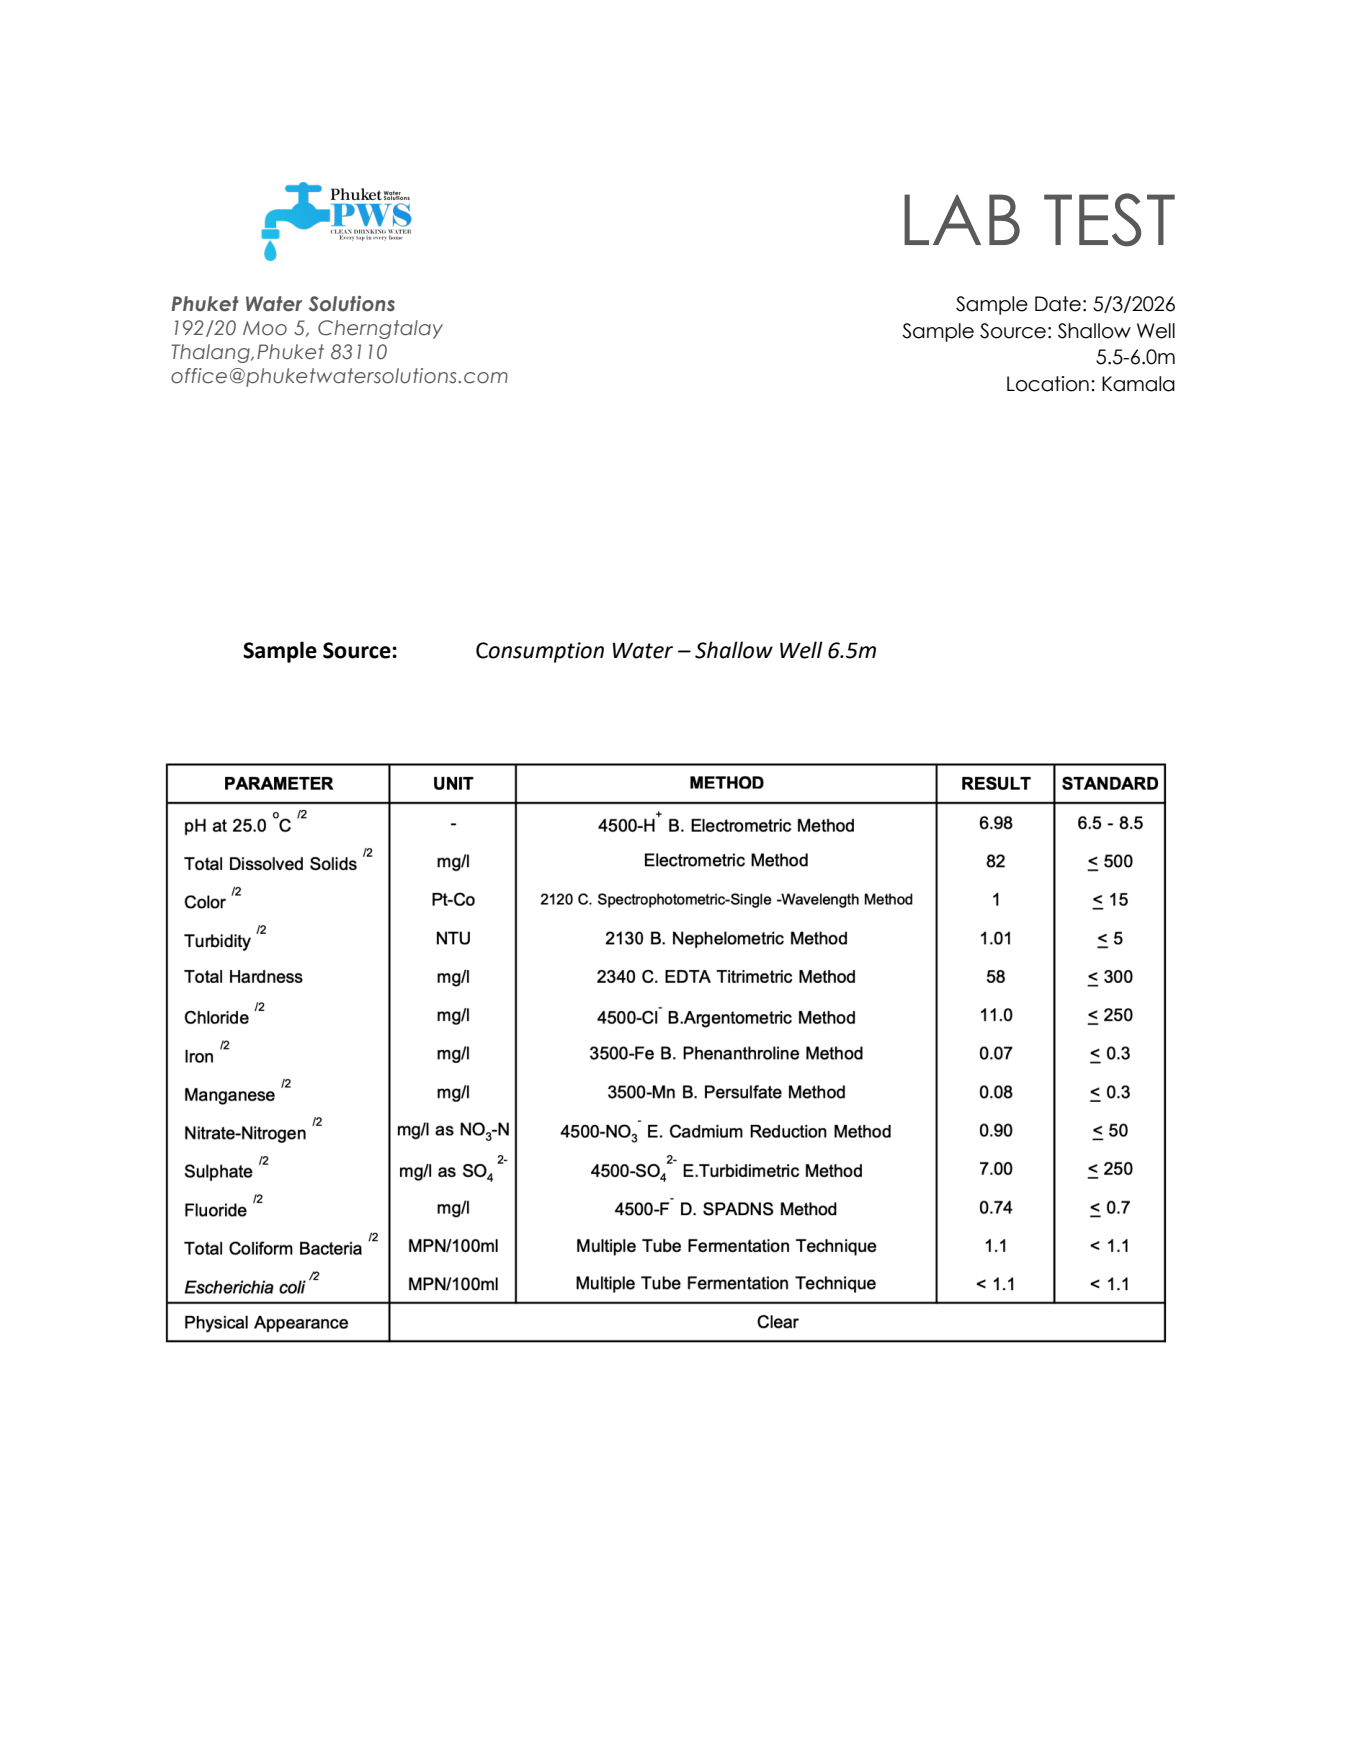
Before installation context
Kamala shallow-well report
- Sample date
- 5 March 2026
- Location
- Kamala
- Pages
- 1
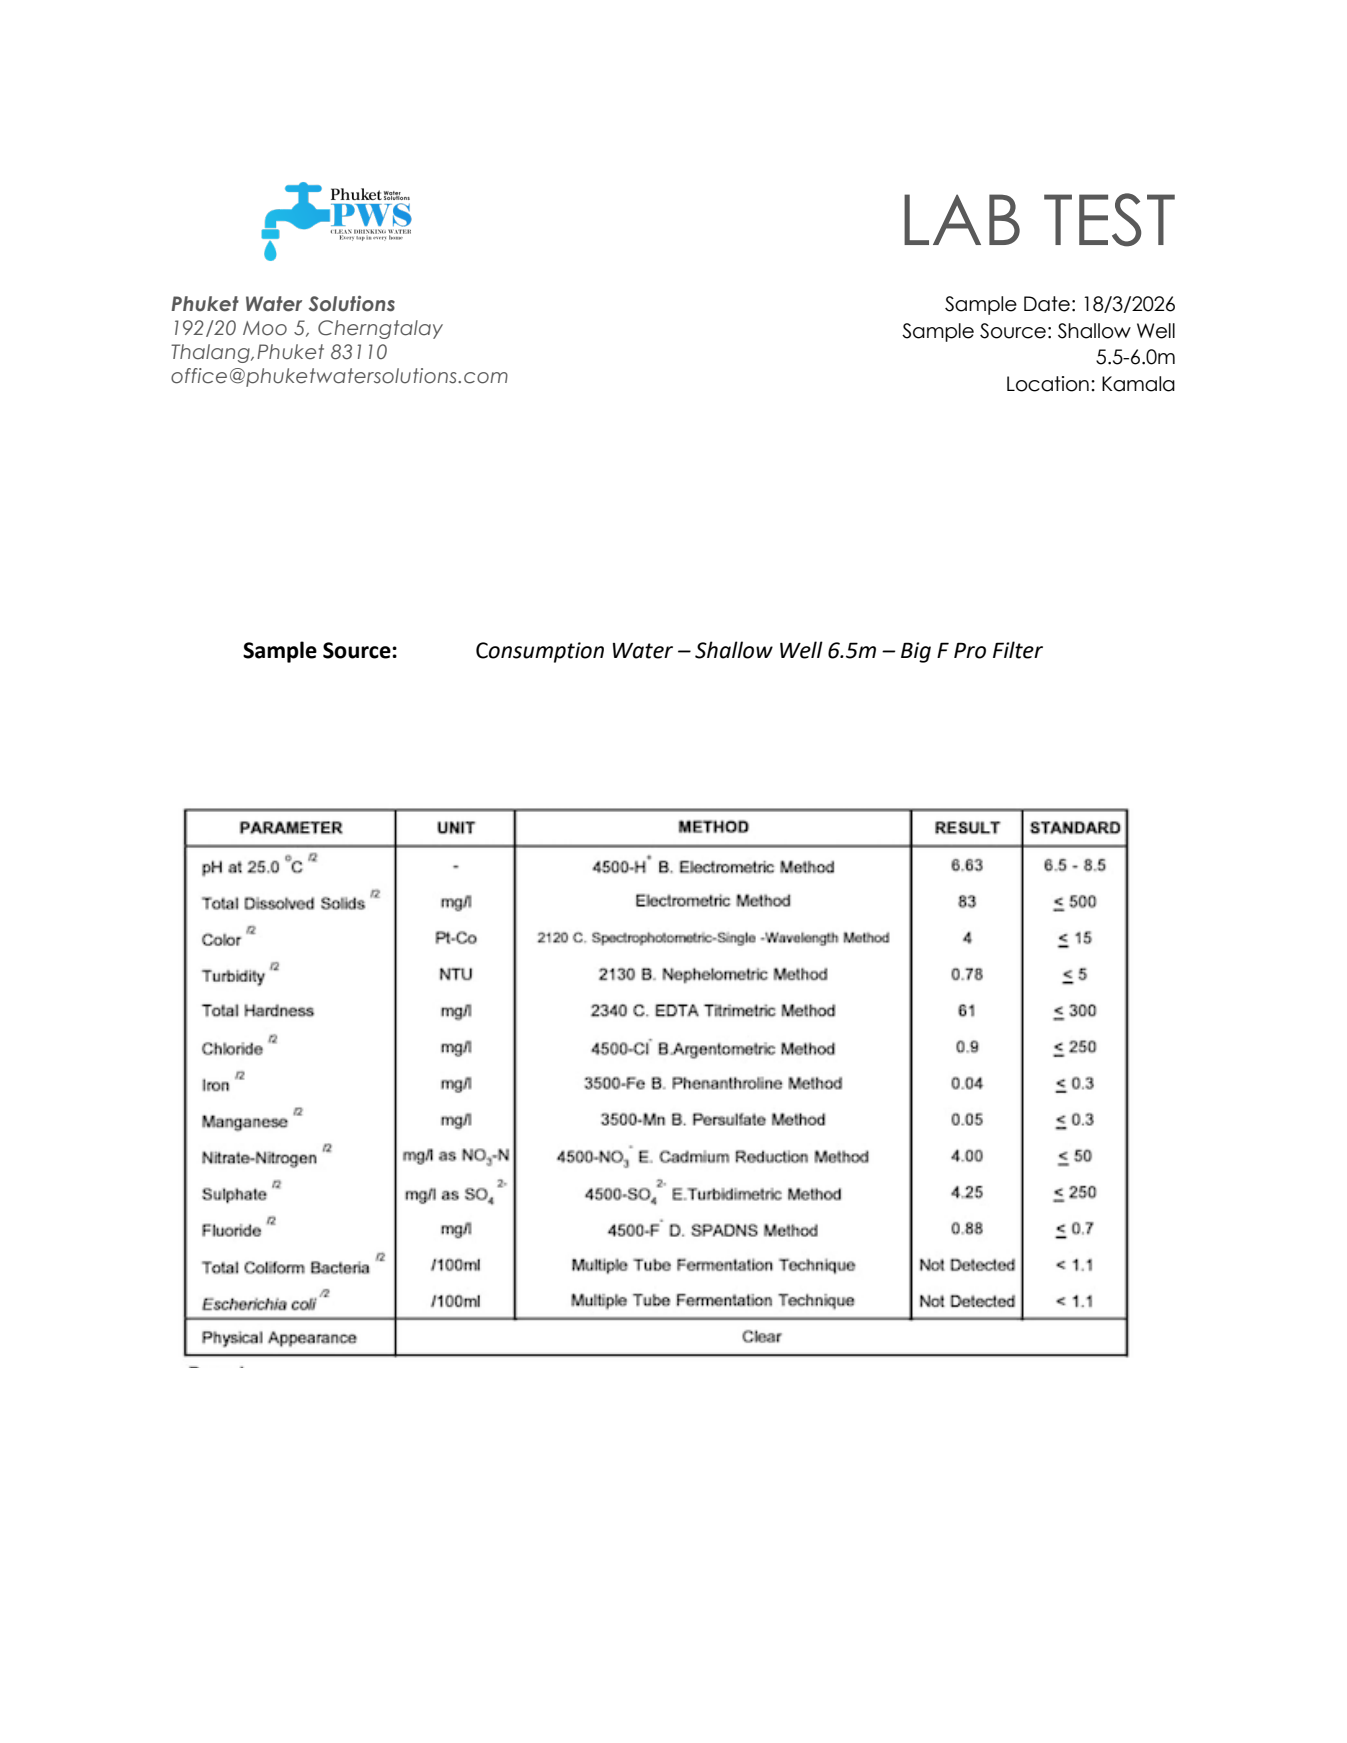
Later filter context
Kamala BIG F PRO report
- Sample date
- 18 March 2026
- Location
- Kamala
- Pages
- 1
Evidence boundaries
What this comparison can - and cannot - show
Transparent limitations make the result more useful. These records support a property-specific discussion, not a universal product-performance or drinking-water-safety claim.
Two samples, not a long-term study
Source water can vary by rainfall, pumping, storage and other operating conditions. Repeated sampling is needed to assess consistency.
No controlled attribution
The reports are 13 days apart and do not document a controlled test protocol. Differences cannot be attributed to the filter alone from these documents.
Limited provenance
No separate laboratory, accreditation, sampler, chain of custody or uncertainty statement is named on the uploaded reports.
Not a complete safety declaration
The panel covers 13 parameters. Other microbiological, inorganic, organic or site-specific concerns may require additional testing.
Because fluoride is above the printed maximum in both reports, confirm the intended water use and discuss targeted retesting before making a treatment decision.
Plan from evidence
Use your own water results to choose the next step
Share your source, symptoms, property demand and any existing reports. PWS can help identify whether you need additional testing, a site assessment or a treatment recommendation.